PROCEDURE:
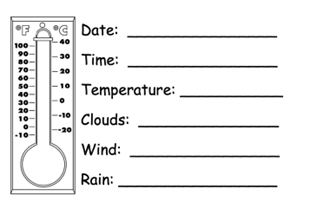
DATA SHEETS – Fill in one data sheet per week. Have students take turns filling in the data sheets with teacher assistance or have each child do one and put in there own personal data “pocket.”.
TEMPERATURE – Place the class thermometer outside in the shade before taking the temperature. The thermometer should be vertical. Students take the temperature in the same place and at the same time of day for each measurement. Measurements should be taken at least once a week from September 15 to March 31. Use the Fahrenheit side (°F) since that scale is what is most commonly used for weather in the United States or if you want use Centigrade.
Students will need help understanding the numbers. Teachers should have students try to identify the numbers where the red line ends on the thermometer. As they get more used to measuring temperature (focus of the first docent lesson) and learning their numbers, they will be able to read the numbers on their own.
CLOUDS – Students should look at the sky and see if there are clouds and what type they look like. They should mark the appropriate box. They will learn the cloud type names in the second lesson, but until then they can look at the pictures.
WIND – Students should mark if there is no wind, a little wind or a lot of wind.
RAIN – Students should mark if there is no rain, a little rain or a lot of rain.
Once the data sheet of the day is finished, it should be placed in the class data collection envelope until it is time to graph the data.
After a few months, the class can start graphing the data on the class graph or you can start graphing from the first data. Using the dates at the bottom of the graph, record the temperature for that day. At the top of the graph, there are spaces for symbols or icons to record cloud, rain and wind conditions.
Once the graph is done, ask students to look for patterns. What month was it coldest? What month was it warmest? What months did we get the most rain? Do you see some conditions that are the same most days?